
Inside Fore Coffee IPO: A Financial Breakdown
We unpack the revenue, margins, and expansion strategy behind one of Indonesia’s fastest-growing coffee chains.


Fore Coffee has officially crossed a milestone that most consumer brands in Indonesia only talk about. It entered the public market on April 14, 2025, listing on the Indonesia Stock Exchange (IDX).
The company offered 1.88 billion shares at Rp188 per share, raising approximately Rp353.44 billion in fresh capital. The IPO was oversubscribed 200.63 times.
That level of demand doesn’t happen by accident.
It reflects confidence in the brand, in the growth story, and in the broader consumer narrative in Indonesia. The stated use of funds?
Aggressive expansion, targeting 140+ new outlets
Development of its new product vertical, Fore Donat
On the surface, this looks like a textbook growth story:
Revenue doubled
Profit turned positive
Store expansion accelerated
But IPO is not the finish line. It’s a transition. Because once you enter the public market, expectations shift.
Growth alone is no longer enough
Brand love alone is no longer enough
Expansion alone is no longer enough
Public markets demand something else:
Margin durability
Capital discipline
Predictable execution
Sustainable unit economics
Private markets reward momentum. Public markets reward consistency. So in this piece, we’re not looking at the headlines. We’re looking at the numbers.
We’ll break down:
How Fore was built and structured
What actually went well in the financials
Where the pressure points are emerging
And what we think matters going forward
Because growth looks strong.
Margins are improving. But the real test starts now.
Our Sources: Fore Coffee - Investors Annual Report
FORE Financial Report 9M25 (Unaudited)
FORE Financial Report 1H25 (Unaudited)
FORE Financial Report FY 2024 (Audited)
Note: This is not financial advice. Not a stock recommendation. Just my view as someone who enjoys following the evolution of retail, operations, and consumer businesses in Indonesia. Let’s unpack it together.
1. Fore: The Setup Before the Numbers
Before we dive into revenue, margins, and operating leverage, we need to understand how Fore was built. Because financial outcomes rarely happen by accident.
They reflect structure.
A. Built in 2018 - Scaled Fast
Fore Coffee was established in 2018 and began commercial operations in August that year. In under seven years, it scaled to:
231 stores by end of 2024
291 stores by September 2025
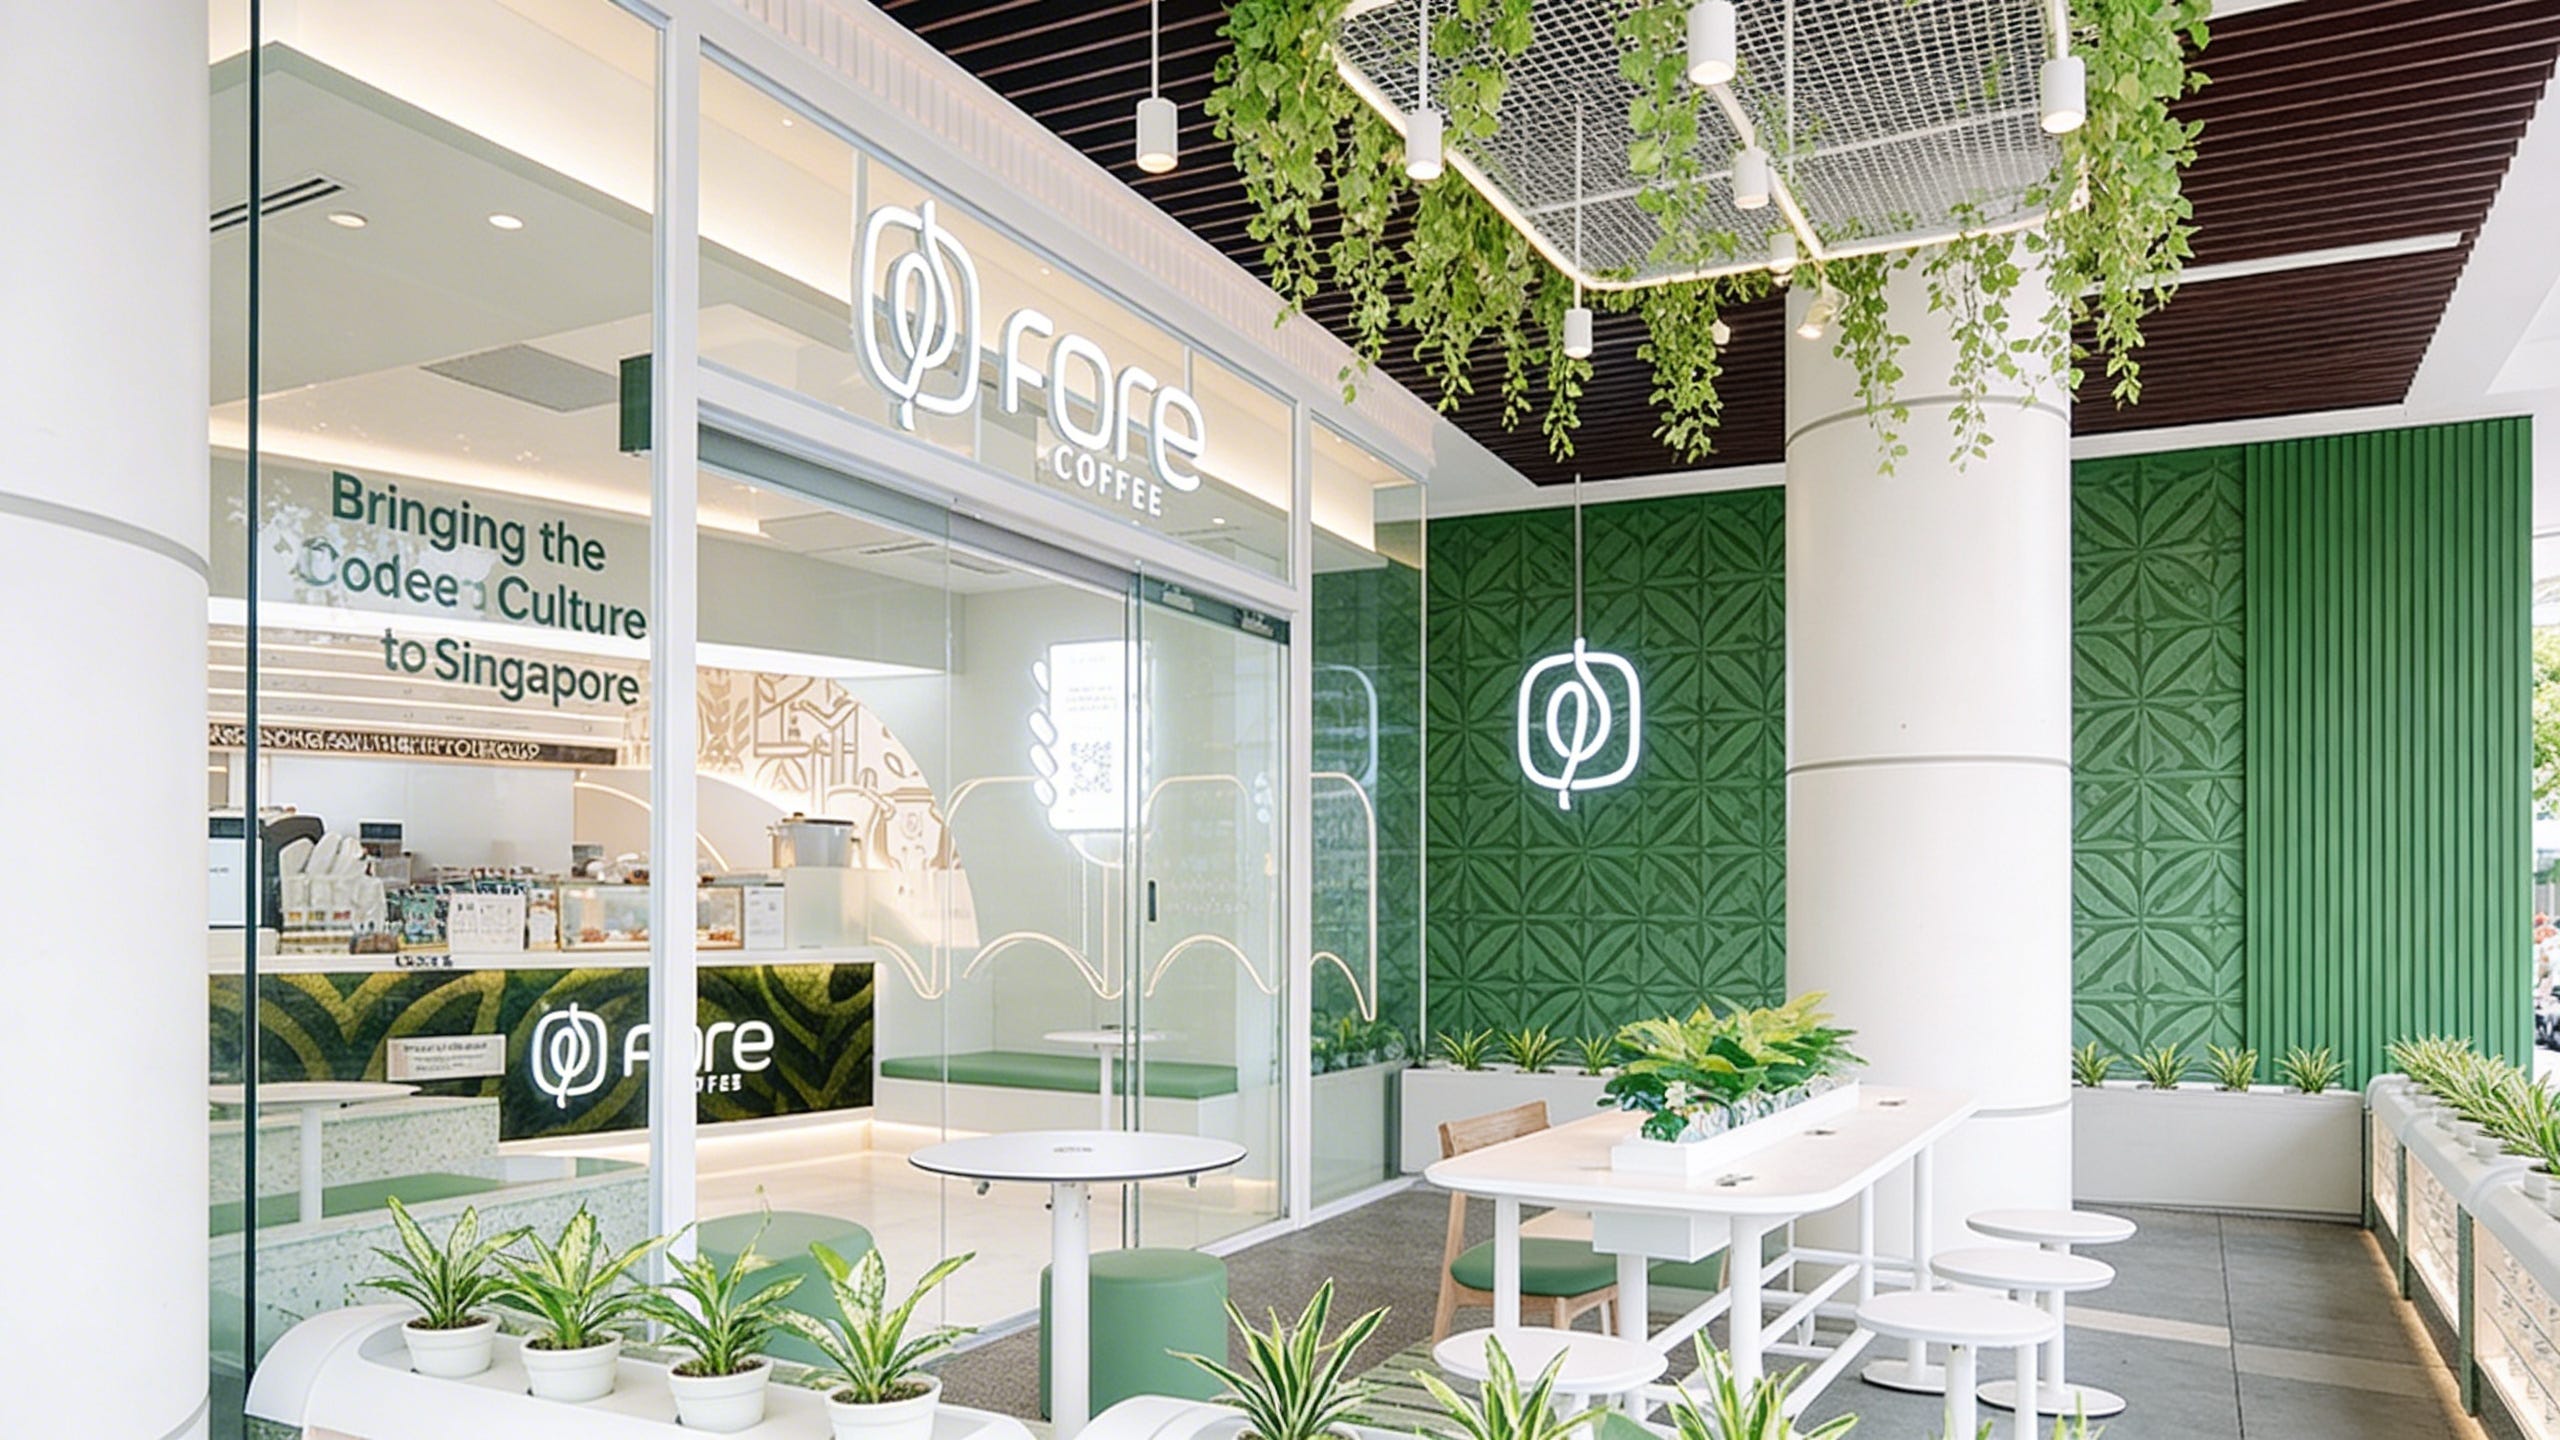
Plus 2 stores in Singapore
That’s +60 stores in roughly nine months. But the more interesting part? This business and expansion happened through the tough time of COVID, where most retail F&B brand either:
Slowed dramatically
Closed stores
Burned cash aggressively to survive
Or stalled fundraising
Fore survived that cycle. And more importantly, they came out stronger. By 2024, revenue more than doubled year-on-year, and profitability turned positive before IPO. That timing matters.
They didn’t IPO during peak hype.
They IPO’d after showing operational recovery and margin improvement.
B. Fundraising & Institutional Pathway
Before Fore became a public company, it went through something equally important: It institutionalized.
Fore wasn’t just opening stores and hoping for scale. From the beginning, it raised capital deliberately building governance, strengthening balance sheets, and preparing for something bigger than just retail expansion.
You see a full capital cycle: Early conviction → Institutional scaling → Crisis survival → Stabilization → Public listing.
Here’s how that journey unfolded:
A. Fundraising Timeline (2018 - 2019)
Seed Round: Undisclosed (Sep 2018)
Series A: US$8.5 Million (Jan 2019)
Series A Extension: US$1 Million (Apr 2019)
While Tracxn lists Fore at US$40 million raised across 3 rounds, we avoid framing that as a straightforward US$40 million Series B, as later company disclosures point to a more complex mix of financing instruments.
B. Crisis and Stabilization (2020 - 2022)
Navigated pandemic disruption
Maintained store network
Stabilized cost structure
Continued institutional backing
C. IPO - Indonesia Stock Exchange (2025)
1.88B shares issued
Rp188 per share
~Rp353.44 billion raised
Oversubscribed 200.63x
C. Not Just Offline: Tech-Enabled Retail
This is another underrated angle. Fore operates not just as a cafe chain, but integrates:
App-based ordering
Loyalty program ecosystem
Digital payment integration
Simpler pickup workflows
Why does this matter? Because in Indonesia:
Delivery platforms take margin
Promo wars erode profitability
Offline-only players struggle with retention
A strong app + loyalty layer can:
Improve repeat frequency
Reduce marketplace dependency
Increase data visibility
Improve targeted promotions
The real long-term moat for modern F&B chains isn’t just location. It’s data + repeat behavior. The question is: How strong is Fore’s digital stickiness relative to competitors?
That will influence margin durability.
Raising capital is not the same as deploying capital well. Surviving a crisis is not the same as building long-term margin strength. And IPO is not validation, it’s escalation. Once you enter the public market, the standard changes.
Growth needs to be repeatable
Margins need to be defendable
Expansion needs to be disciplined
So the real question now isn’t whether Fore built a compelling story. It’s whether the numbers support it. Let’s move to what actually went well.
2. What Went Well in the Numbers
At a high level, the headline is clear:
Fore didn’t just grow. It improved.
And that distinction matters.
Because in consumer F&B, it’s relatively easy to grow revenue.
It’s much harder to grow while fixing your economics.
A. Revenue Didn’t Just Grow, It Scaled
Let’s start with the most obvious signal
2023 Revenue: ~Rp482B
2024 Revenue: ~Rp1.04T
That’s ~2.15x growth YoY.
Then into 2025:
9M 2024: ~Rp727B
9M 2025: ~Rp1.04T
That’s another ~43% growth on an already scaled base.
Why this matters:
This is no longer early-stage growth.
This is post-scale growth compounding on top of a billion-rupiah base.
And that typically only happens when:
Store-level performance is holding
Expansion is working
B. Gross Margins are Strong & Holding
Their gross margins are strong & holding
2024 Gross Profit: ~Rp634.9B on Rp1.04T
~61% gross margin
9M 2025 Gross Margin: ~Rp643.5B / Rp1.04T
~62% gross margin
Key insight: Margins didn’t collapse with growth. That’s critical.
Because in many F&B chains:
Growth → more promos
More promos → margin compression
Fore is showing the opposite:
Scaling without structurally breaking gross margins
Which suggests:
Strong pricing power (relative to cost)
Decent supply chain control
No excessive dependency on discounting
C. Operating Leverage is Starting to Show
This is one of the real signals.
2023 Operating Income: ~Rp67M
2024 Operating Income: ~Rp66.4B
That’s a step-change in profitability. And then:
9M 2025 Operating Income: ~Rp65.2B
Already matching full-year 2024.
What’s happening here? What’s driving it?
At a high level Revenue is growing faster than cost structure.
Even though:
Selling expenses are still large (~Rp475B in 9M 2025)
And G&A adds another ~Rp103B
Combined, operating costs (Selling + G&A) reach ~55% of the revenue
Fore is still expanding operating profit. That’s early operating leverage kicking in.
Fixed and semi fixed costs are being spread across higher revenue
Store level productivity is improving
The system is starting to scale more efficiently
But importantly:
This is still early-stage leverage, not fully optimized leverage
A Quick Reference Point
For context, mature operators like Starbucks operate with:
Source: Starbucks FY25 Annual Report
Higher gross margins ~72%, based on reported product and distribution cost of ~27.9% of revenue
Lower G&A at ~1.8% of revenue
This isn’t a direct comparison. But it highlights:
The model is already working
The efficiency curve is still ahead
D. Growth Quality is Improving, Not Just Growth Itself
Let’s not miss this.
2023: Loss-making
2024: ~Rp52.9B profit before tax
This is not just top-line growth. It’s higher-quality growth
This is not incremental improvement. This is a full transition from loss → profitability.:
Profitability has turned positive
Operating income is scaling with revenue
Expansion is happening alongside improving margins
This suggests:
New stores are not purely dilutive
Existing stores are likely improving in productivity
The system is becoming more stable
Why This Matters
Many consumer brands grow like this:
Revenue ↑
Costs ↑ faster
Losses widen
Fore is showing the opposite pattern:
Revenue ↑
Costs ↑ (but slower)
Profitability ↑
That’s a meaningful shift.
E. Expansion Without Breaking the System
Store count:
2024: 231 stores
Sep 2025: 291 stores
+60 stores in ~9 months. Yet:
Margins held
Profitability improved
Revenue scaled
That combination is rare. Most brands can only pick two:
Growth
Profitability
Margin stability
Fore (so far) is showing all three.
But strong numbers don’t mean perfect numbers. Because if you look closer:
Operating costs are still heavy
Margin buffer is not that wide
Expansion is still aggressive
Which means:
The question is no longer “Can Fore grow?”
The question is “How resilient is this model under pressure?”
3. Where the Pressure Points Start to Emerge
So far, the story looks strong:
Revenue is scaling
Profitability has turned positive
Growth quality is improving
But this is exactly where the dynamics change. Because once a business becomes profitable:
The question is no longer “can it grow?”
The question is “How resilient is this model under pressure?”
A. Store Expansion vs Store Productivity
A large portion of Fore’s cost base is tied to:
Depreciation
Store salaries
Rent
All of which scale with new store openings. From the data:
Selling expenses remain ~45% of revenue
And a significant portion is store-driven costs
The Pressure
Expansion adds revenue
But it also locks in fixed and semi-fixed costs
Which creates a key risk:
If new stores ramp slower than expected
Or cannibalization starts to happen
Then:
Cost scales immediately
Revenue lags
What Matters Going Forward
Same store sales growth (SSSG)
Payback period per store
Maturity curve of new outlets
Our Conviction
What really matters is not how fast Fore expands, but how disciplined it is in expansion.
The winners in this category are not the ones opening the most stores. They are the ones that:
Maintain tight payback periods
Know when to double down
And more importantly, when to stop or cut underperforming stores
Because in the long run:
Expansion without productivity is just delayed inefficiency
B. Delivery Exposure & Margin Dilution
From the cost breakdown:
Delivery & commission
Logistics
Together form a meaningful part of selling expenses. This reflects a hybrid model:
Fore is both an offline retail business and a delivery-driven one
The Pressure
Delivery growth comes with:
Platform commissions
Promo intensity
Lower per-order margins
Which means:
Not all revenue is created equal
What Matters
Channel mix (offline vs delivery)
Platform dependency
Strength of owned channels (app, loyalty)
Our Conviction
What matters is not just growing revenue, but owning the relationship behind that revenue.
If growth is driven too heavily by third-party platforms:
Margins get compressed
Customer ownership weakens
The long-term winners are the ones that:
Use delivery for acquisition
But gradually shift users into owned ecosystems
Because:
Margin expansion ultimately follows channel control
C. G&A Still Elevated
From reported numbers: G&A sits at ~10% of revenue. This is still elevated relative to more mature systems.
The Pressure
At scale:
G&A should compress
If it doesn’t:
Complexity may be scaling faster than revenue
Organizational inefficiencies can start to build’
What Matters
Revenue per HQ employee
Central cost discipline
Ability to scale without proportional overhead
Our Conviction
What matters is how fast Fore can compress its organizational cost structure.
Growth can hide inefficiencies for a period of time. But over time:
Every extra layer
Every duplicated function
Every inefficient process
Will show up in the P&L. The best operators don’t just scale revenue.
They scale without carrying unnecessary weight
D. Margin Buffer Is Still Thin
From earlier:
Gross margin: ~61–62%
Implied COGS: ~38–39%
Compared to global peers (~70–72%), this is structurally lower.
The Pressure
Lower gross margin means:
Less room to absorb shocks
Such as:
Input cost increases
Competitive pricing
Promo pressure
What Matters
Pricing power
Product mix optimization
Supply chain efficiency
Our Conviction
What matters is whether Fore can expand its margin buffer over time.
Because:
A business with thin margins can grow
But it cannot absorb volatility
The strongest consumer brands:
Build pricing power
Improve product mix
And continuously optimize cost of goods
Because:
Margin is not just about profitability. It’s about resilience
E. Operating Leverage Can Reverse
Operating leverage is starting to show:
Revenue is growing faster than costs
Profitability is improving
But this dynamic is not one-directional.
The Pressure
If growth slows:
Fixed costs remain
Store costs don’t adjust quickly
G&A doesn’t immediately compress
What Matters
Consistency of revenue growth
Stability of store level performance
Cost flexibility
Our Conviction
What matters is not just achieving operating leverage, but sustaining it through cycles.
Because:
Expansion phases make everything look efficient
Slower phases reveal the true structure
The real test is not during growth.
It’s during normalization
At this point, the picture becomes clearer:
The model works
Profitability is emerging
The system is scaling
But the next phase is different.
It’s no longer about proving that the business can grow
It’s about proving that it can withstand pressure while continuing to grow
4. Our Final Thoughts

Stepping back, it’s hard not to give credit where it’s due. Fore has done what most consumer brands in Indonesia are still trying to figure out:
Built a brand that resonates
Scaled to hundreds of stores
Navigated a tough cycle like COVID
And turned profitable before going public
That combination doesn’t happen often.
So first, kudos to the team. This is not easy to pull off.
At the same time, the numbers show something more interesting. There are real strengths in the model:
Revenue scaling quickly
Profitability already turning
Growth quality is improving
This is a strong foundation.
But the next phase will require something different. Because from here, it’s no longer just about growth. The focus shifts to:
Staying disciplined in expansion
Improving store-level productivity
Strengthening margin structure
And building more control over demand
In our view, growth got Fore here.
The next phase is really about how disciplined they can be as they scale.
This is where things usually get harder.
Not because the model doesn’t work, but because small inefficiencies start to matter more at scale.
If they get this right:
Expansion compounds
Margins improve
And the system becomes stronger over time
If not:
Costs creep up
Margins get pressured
And growth becomes harder to sustain
So the story is already strong. Now it’s about execution and how well the structure can hold as the business gets bigger.
5. Closing
Thank you for reading until the end, really appreciate it!! Here’s our brief closing on Fore.
What makes Fore interesting is not just the company itself, but what it represents. We’re starting to see consumer brands in Indonesia that can:
Scale
Survive
And turn profitable
That alone raises the bar for everyone.
From an operator’s lens, this is where things get harder.
Building and scaling is one phase.
Sustaining it at scale is another.
In our view, growth got Fore here.
What happens next will come down to discipline.
And again, kudos to the team.
What they’ve built so far is not easy and we’re rooting for Fore to go even further, not just in Indonesia, but to become a strong Southeast Asia coffee player and beyond.
Before You Go
Let’s do a quick poll
And you can follow our IG @neverlaterventures
Feel free to drop us a message on IG or Substack as well.
Always open to ideas or recommendations on what we should cover next.